3 Operational Metrics The Best Maintenance Teams Focus On

In today’s competitive world, everyone feels the pressure to improve operations and manage costs. Streamlining operations and finding efficiencies are some of the most pressing issues for employees at every level, from the maintenance teams on the plant floor to the C-suite.
Good decisions that improve operational and equipment health metrics require reliable and accurate data. This is where maintenance and operations teams come in.
These teams are the first (and best) channel for collecting valuable information. In the most efficient organisations, no one knows the equipment health and operational metrics as well as the employees who work with them every day. Leveraging your maintenance managers to establish systems, such as continuous conditioning monitoring sensors and a good reporting platform, will ensure that data is collected in a systematic and reliable way so it is at your fingertips when you need it.
For manufacturers, a straight line can be drawn from the success of a company to the quality of data collected and utilised by the maintenance and operations teams. You have the potential to make a massive impact on the organisation’s bottom line by being actively involved in monitoring the key metrics of OEE, AU, and MTBF.

The Key Metrics For Maintenance Teams
The most efficient companies operate according to the principles of Total Productive Maintenance (TPM), a system of physical asset management aimed at maintaining and improving manufacturing machinery, in order to reduce an organisation’s operating costs. Three of the key performance metrics involved in TPM are:
- Overall Equipment Effectiveness (OEE)
- Asset Utilisation (AU)
- Mean Time Between Failures (MTBF)
When calculated properly, these metrics support effective facility management and provide the basis for sound business decision-making. It is much easier to accurately calculate OEE, AU, and MTBF with data provided through continuous condition monitoring. Your maintenance teams should play a key role in seeing when the machines are in use and whether they are performing well or poorly, essentially observing the data ‘live’ as it happens.
Let’s go into a little more detail on each of these metrics.
Overall Equipment Effectiveness (OEE)
OEE establishes the percentage of manufacturing time that is actually productive.
In technical terms, OEE is expressed in the equation:
Availability × Performance Efficiency × Quality Rate
To achieve an OEE score of 100%, or ‘perfect production,’ would require the manufacturing of only good parts, at the fastest possible speed, with no stop time. A score of 85% is considered world-class for discrete manufacturers. However, a score of 40% is common for manufacturers who do not follow the principles of TPM. These statistics make it easy to see just how big of an impact continuous monitoring and data reporting can have on a company’s efficiency.
Asset Utilisation (AU)
AU assesses how efficiently an operation makes use of its assets to generate revenue. Improving this metric improves the bottom line. Plus, if you can get more value from your existing assets, you save on having to purchase more equipment to move the revenue needle.
The value of this metric is illustrated perfectly by a recent case study from CSF Proteins.
CSF Proteins were experiencing downtime and unplanned outages regularly due to equipment failure. Some outages putting equipment out of commission for up to 5 days. Needless to say, asset utilisation was less than ideal to say the least. The organisation made a concerted effort to address these issues, with a focus on increasing AU through the deployment of FitMachine sensors across their assets to provide 24/7 oversight into machine health. Plus, this solution enabled better planning & scheduling to minimise operational impact on downtime. The efforts paid off with CSF eliminating 100% of downtime incidents within 12 months, leading to far greater availability of assets for production and therefore increase in asset utilisation.
Mean Time Between Failures (MTBF)
MTBF is the average time between equipment breakdowns and is crucial to monitor as unplanned downtime is a major source of loss for a business. It is a good indication of the effectiveness of maintenance programs, efficiency of your machines and their general health. Ideally an organisation would have infinite MTBF – meaning machines never fail. However we can safely assume that’s an impossible feat. But even a small increase in MTBF has a flow-on effect to many other areas of the business, and the metrics discussed above.
One can’t discus MTBF without also mentioning MTTR – so we’ll throw this metric in as a bonus!
Mean Time To Repair (MTTR)
Mean Time To Repair is the average time it takes to repair a system (usually technical or mechanical). It includes the actual repair time, and any testing periods. MTTR is incredibly important to keep in mind when trying to move the needle on productivity and battling downtime. Relying on traditional equipment inspection and routine maintenance often blows out this metric. For instance, an inspection may reveal machine issues, however the right specialist or a replacement part may not be available to complete repair straight away. This then means an extended period where equipment may operate inefficiently or fail, therefore affecting OEE and AU.
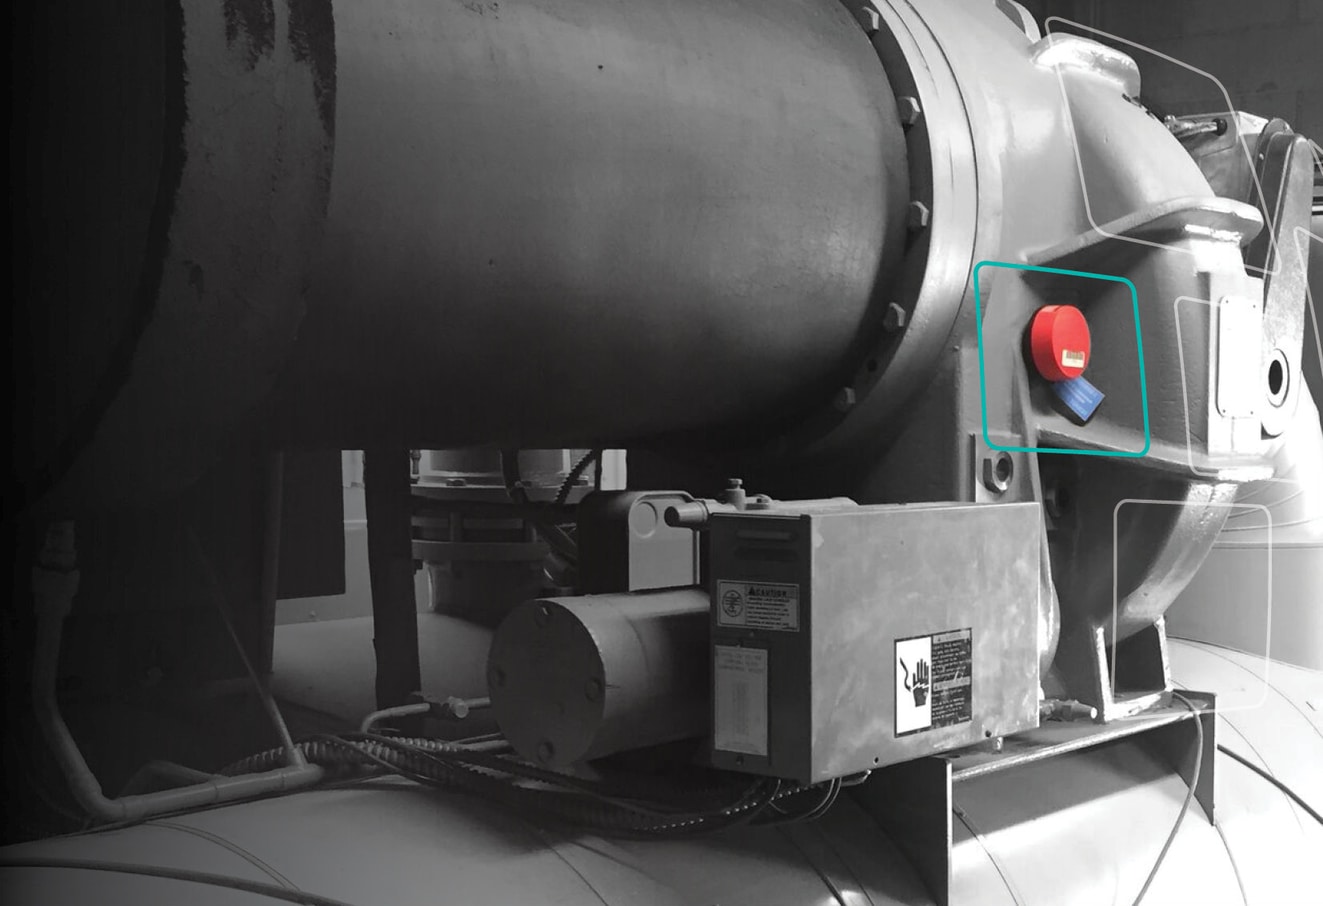
Condition-monitoring platforms like MOVUS’ enables the identification of part-specific issues like bearing faults without stopping equipment operation. That means replacement parts can be procured and prepared ahead of any required downtime for maintenance.
By monitoring your equipment health in real-time you can reduce your MTTR, OEE and AU in real-time. That’s extremely valuable to a business, and a trait of the most effective teams.
Empowering Your Maintenance Teams
 If this all sounds a little too technical and complex, know that it doesn’t have to be. The important thing is that the employees who run and maintain the equipment are actively involved in and empowered to observe and collect data that will support TPM.
With tools like FitMachine and MachineCloud teams can access the information they need, when they need it.
These are easy-to-implement solutions that enable teams (and organisations as a whole) to better understand their equipment health, and the real-time impact that is having on various performance indicators.
—
Looking to get started with 24/7 equipment condition monitoring? Try our platform for free.
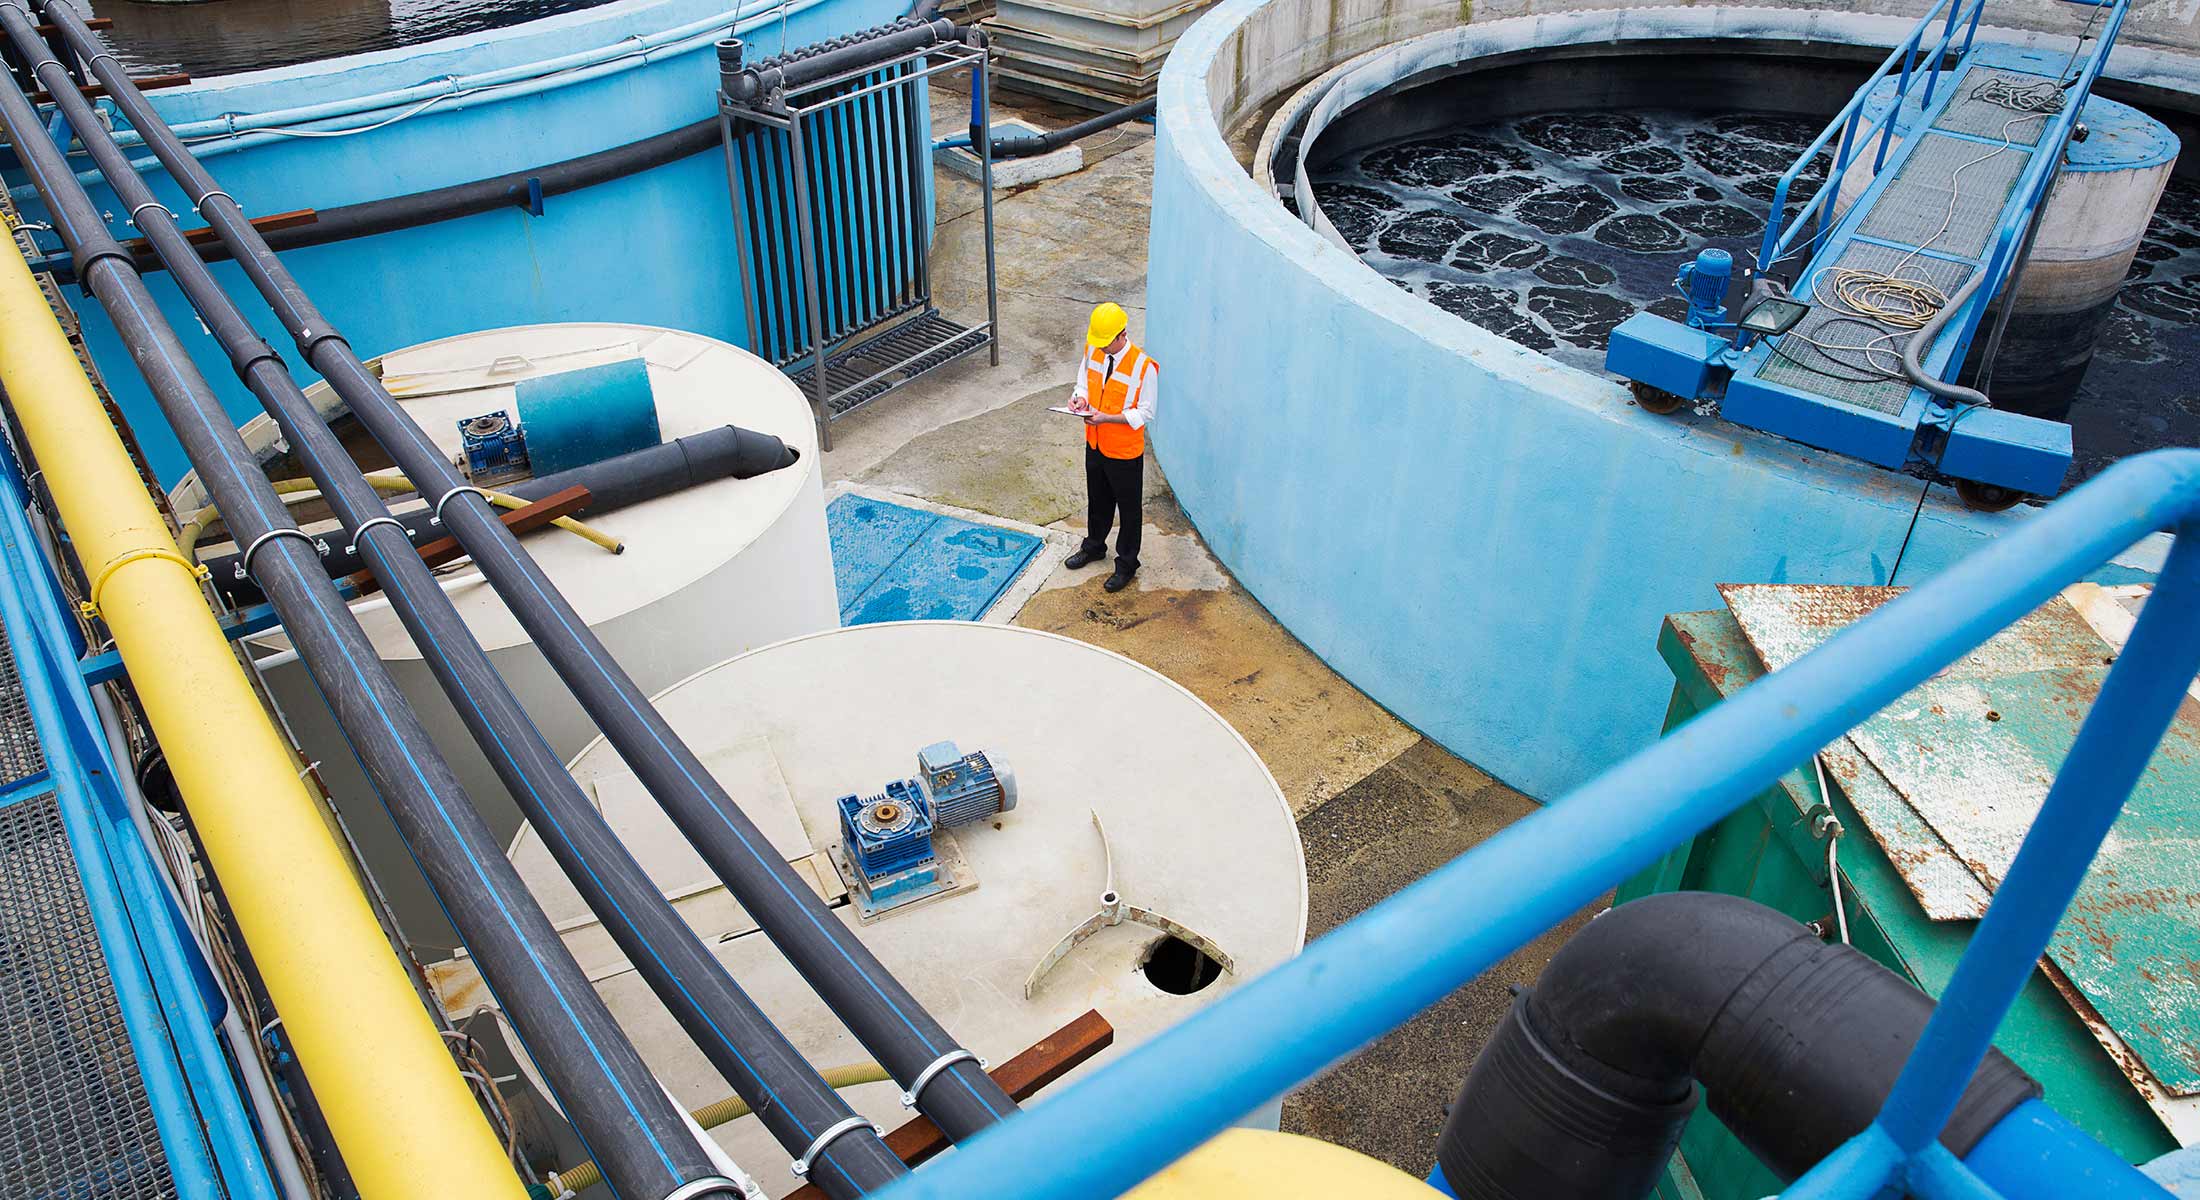
Image sourced from https://www.locustec.com/blog/rethinking-urban-water-management/


