One of the fundamental methods used by vibration analysts [VA] in traditional fault diagnostics are Fast Fourier Transforms, often abbreviated as FFTs. Through their analysis, FFTs can assist with preliminary fault identification and help to determine which maintenance activities are likely to resolve the issue.
But there’s just one problem.
Though commonly understood by the experts, for the average Joe, it can be hard to know what you’re looking at, and for, when faced with tools like FFTs. Even with access to them, thanks to vibration monitoring devices like FitMachine, oftentimes you still need to bring in a contract VA to make any use of it.
Today, I hope to change that.
No, I can’t make you a VA in one day. But, we can start with the basics and work first to understand what an FFTs is. The next step, how to interpret them, will come soon, in a later article. So let’s begin! Starting with the foundation - what vibrations are.
What are Vibrations?
Vibrations are one of the most common forms of material movement seen in our everyday lives. Vibrations consist of a periodic, often rapid back and forth movement of a material from one position to another. Almost every device around us will vibrate to some degree under normal operation, even though these vibrations may not be visible to the naked eye.
Although vibrations are normal for operating equipment, even tiny changes in conditions can significantly impact the vibrations of a system, and, consequently, negatively affect the equipment’s performance. This is because vibrations travel, and a change in one location can propagate to another through the stretching and compression of molecules.
Thus, loose bearings or mounting bolts, or bent and misaligned shafts, for example, will impact what vibrations we record from equipment. Further, a change in recorded vibration data or abnormal data could be a sign of machine wear or breakage and an indication that a failure could be imminent.
How is Vibration Data Displayed?
Raw Data Vibration Graph
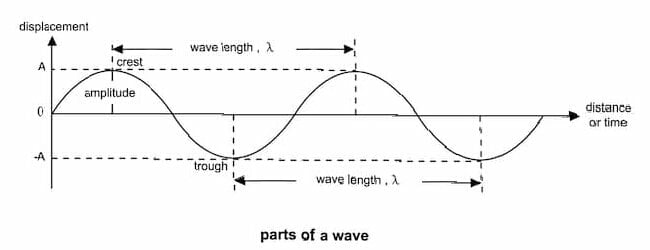
Recorded vibrations are often viewed as a class of functions known as sinusoids, an example of which can be viewed below. These functions consist of displacement or amplitude on the y-axis (vertical axis) and time on the x-axis (horizontal axis).
 Source: https://www.technoupendra.com/2020/02/what-is-electromagnetic-distance.html
This wave can be broken down into the following sections: amplitude, wavelength (period), troughs, and crests.
This visualisation can be used to understand the frequency of the equipment, as the frequency is the inverse of the wavelength (1/Wavelength). This means that frequency and wavelength and inversely proportional - the shorter the wavelength, the higher the frequency. This is illustrated in the image below.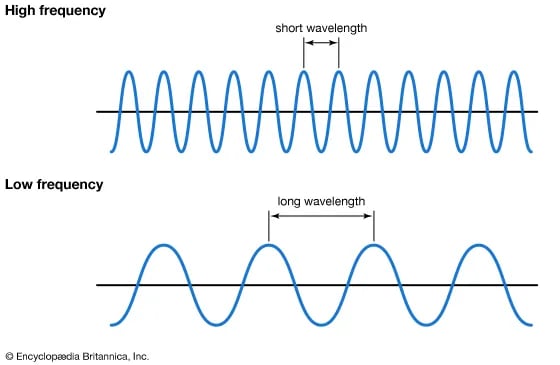
Source: https://kids.britannica.com/students/assembly/view/223513
It’s important to note that, within real applications, the raw data a vibration monitoring device like FitMachine will produce is not clean, readable data like illustrated above. Vibrations are often much more erratic and unpredictable, as different materials vibrate at different frequencies, and separate irrelevant vibrations (known as “noise” or “chatter”) may be observed. As such, hundreds of singular vibrations can be monitored.
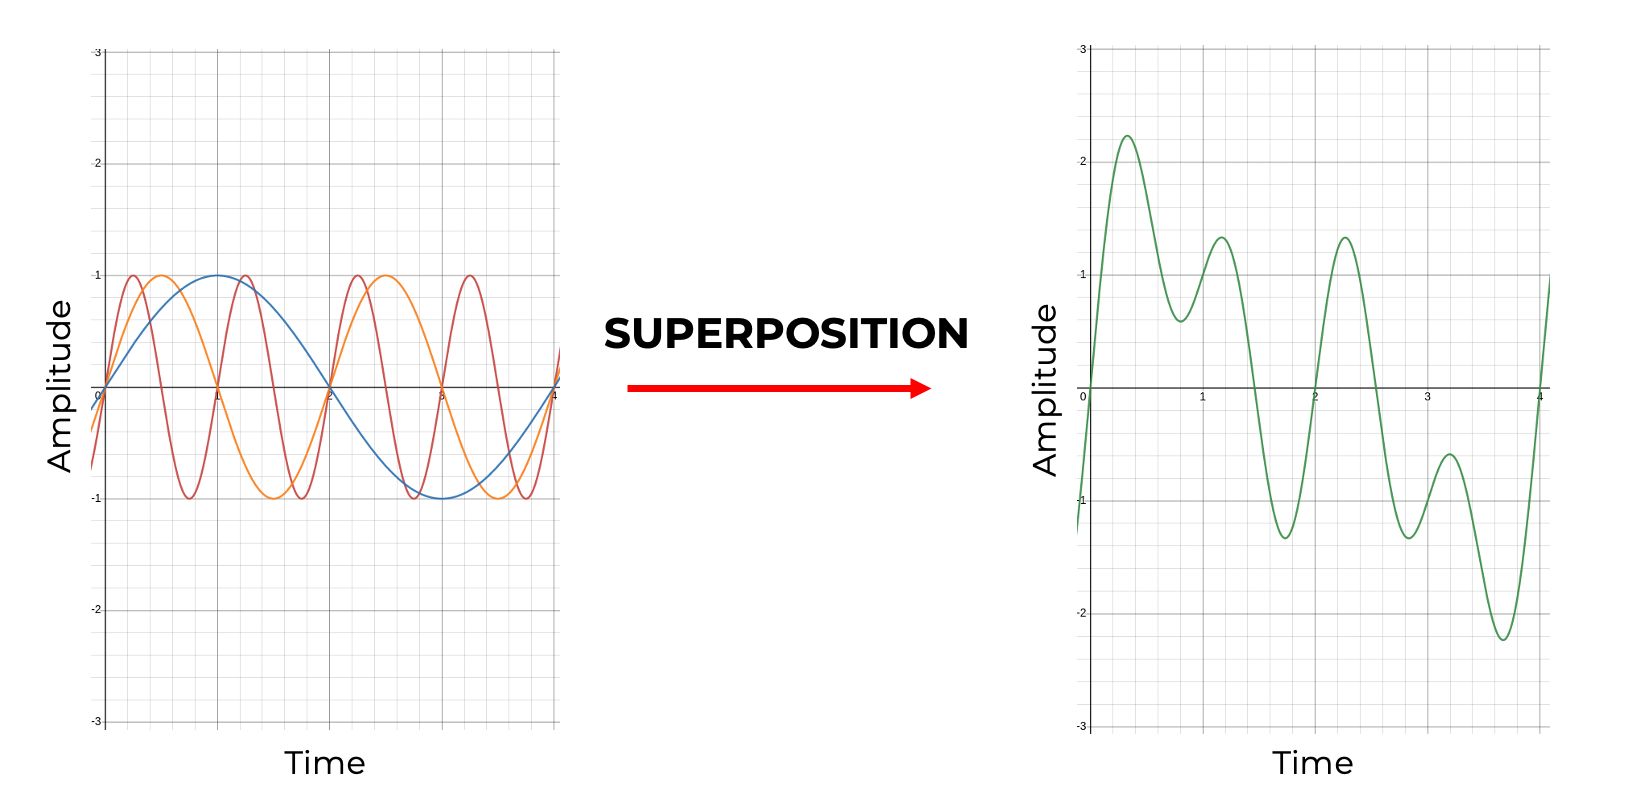
However, when two or more vibrations travel through the same medium, the resulting vibration can be calculated by superimposing (adding) the vibrations together. This superposition creates one graph, plotting the multiple vibrations as one vibration. This is what the FitMachine does to create the raw data vibration graph.
An example of this process is displayed in the following images. Here three different vibrations have been superimposed and displayed as one vibration (green). Each vibration has an amplitude of 1 and includes the frequencies of 1Hz (Red), 0.5Hz (Orange), and 0.25Hz (Blue). Hertz (Hz) is the notation for frequency per second.
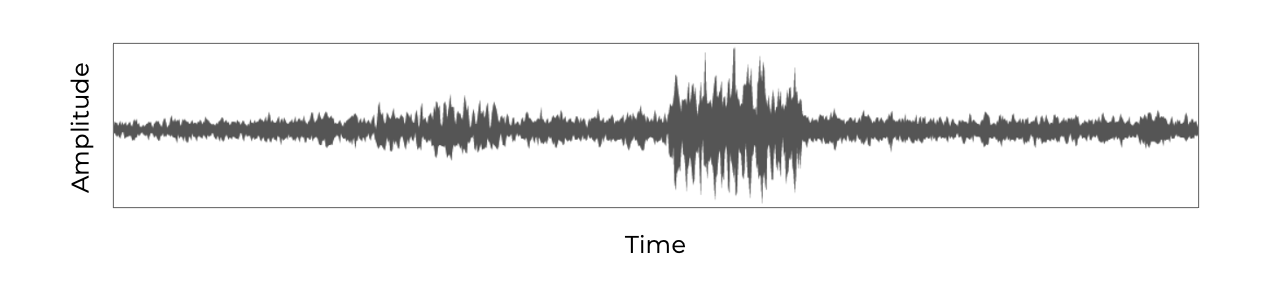
Displaying so many vibrations as one does, however, mean a vibration graph based on raw data is very messy or of little use for determining what is wrong with a machine. An example of this raw data obtained by a FitMachine is below.
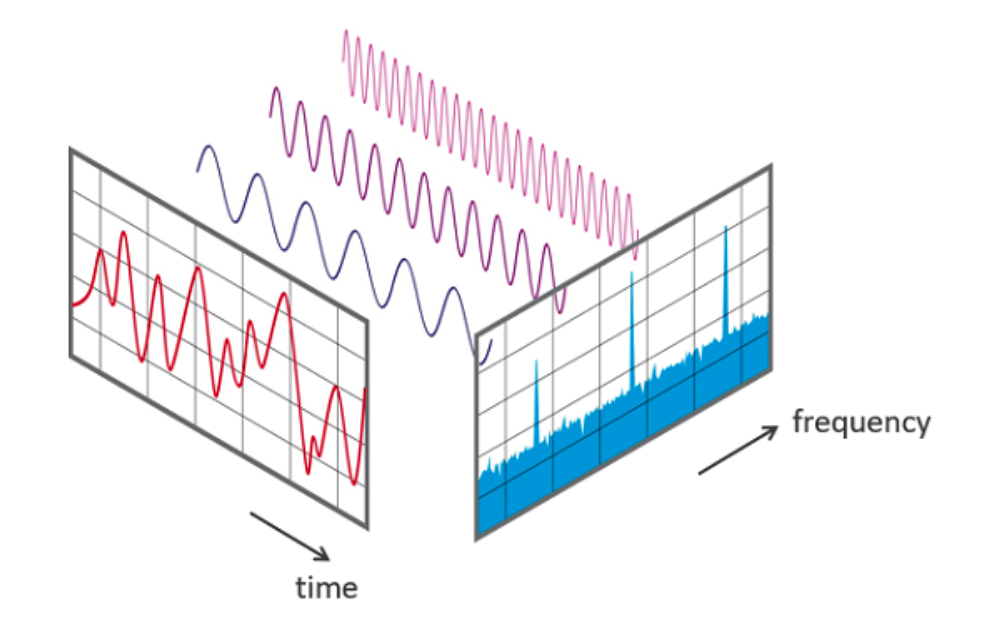
Fast Fourier Transform
To resolve this, FitMachine interprets the raw data into a Fast Fourier Transform (FFT). The job of an FFT is to transform the typically messy Amplitude vs Time plot into an Amplitude vs Frequency plot, which makes understanding how much vibration is occurring at each frequency easier. You think of this as looking at the data from a different angle. In this diagram, the red chart represents the superimposed vibration graph, and the blue represents an FFT of the same vibrations.
 Source: https://www.nti-audio.com/en/support/know-how/fast-fourier-transform-fft
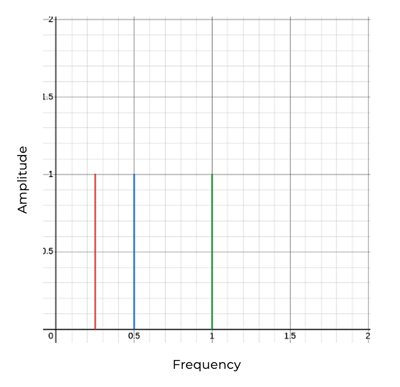
As a simple example, interpreting those same aforementioned vibrations with frequencies of 0.25Hz,0.5Hz and 1Hz would produce the below FFT. From reading this, you can now see that there are 3 vibrations all with amplitude 1, with differing frequencies.
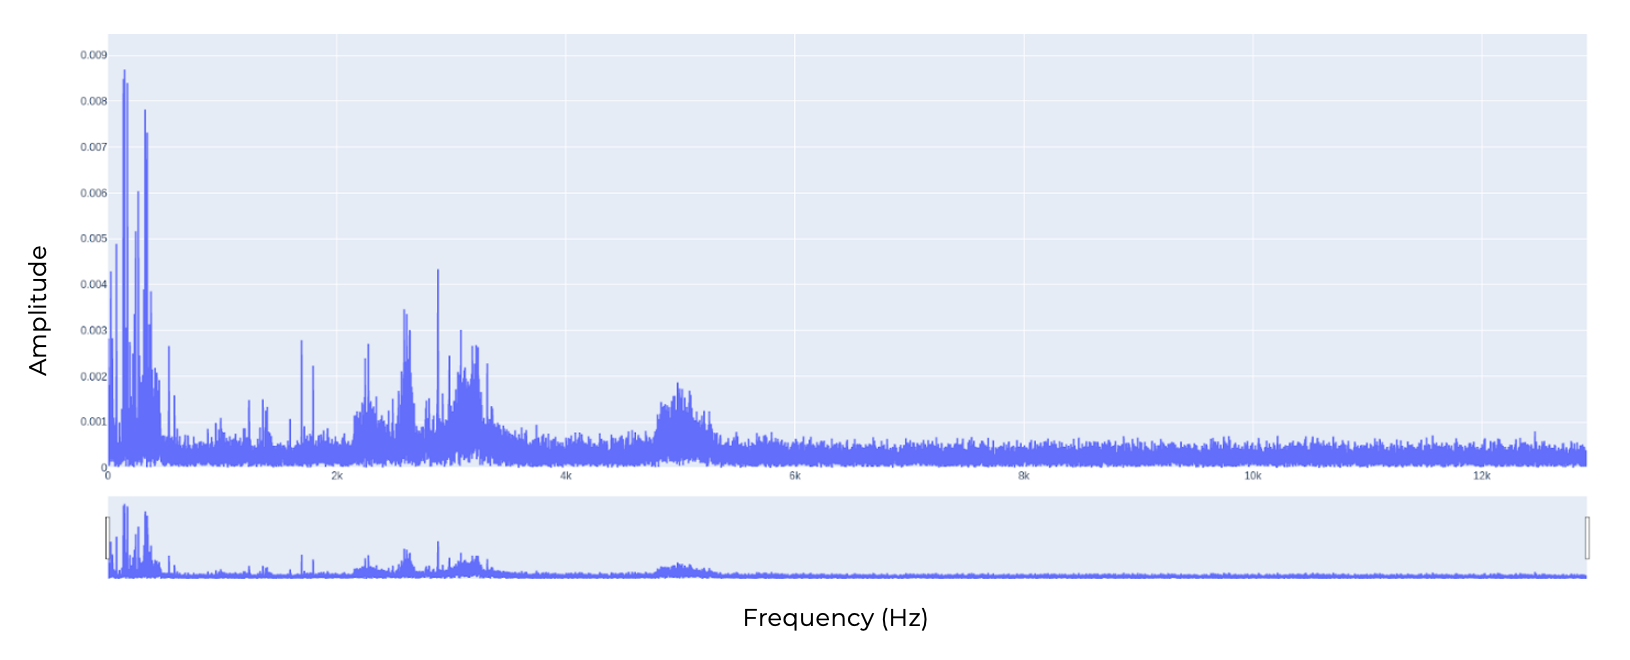
In real applications, there are typically many different frequencies in the vibration profile due to noise. Thus, a typical FFT generated by a FitMachine looks like the plot below.
This is what you'll find in our Interactive FFT feature.
So that’s it! Congratulations. You’ve gained the foundational knowledge behind what an FFTs is, the first step towards understanding how to interpret them. Keep an eye out for our next article on vibration analysis!